Archive: Tables - Best Practices
Please note: this has content related to an outdated template no longer in use.
Tables should be used whenever you have tabular data to display. Their purpose is
to make that data readable, scannable and easily comparable. To build a table in the
OU Editor, start with the table tool (![]() ). Use the table tool to add or delete columns and rows. You can add classes to the
entire table by selecting the table tool and then choosing table properties. Add classes
to individual table cells by selecting the table tool and then choosinng cell > cell
properties.
). Use the table tool to add or delete columns and rows. You can add classes to the
entire table by selecting the table tool and then choosing table properties. Add classes
to individual table cells by selecting the table tool and then choosinng cell > cell
properties.
Build a Basic Table
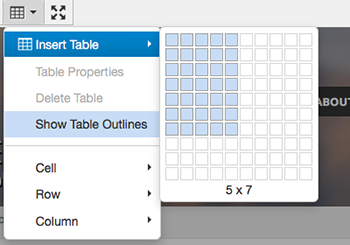
This example table will consist of five columns and seven rows. In the editor, click on the table tool and hover over Insert Table. A selection window will open. Drag across and down to select the number of columns and rows for the table.
 The table will appear on the page in a condensed format because at this point it contains
no data. To expand the table and choose how it will appear, go back to the table tool
and select Table Properties.
The table will appear on the page in a condensed format because at this point it contains
no data. To expand the table and choose how it will appear, go back to the table tool
and select Table Properties.
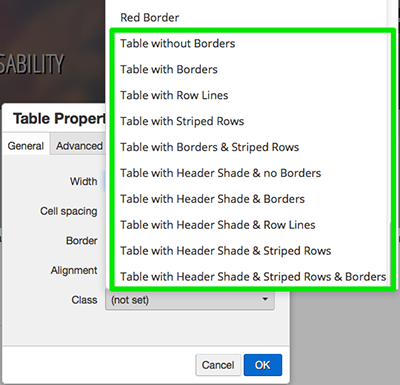
In Table Properites, there is a Class drop-down. Clicking on the drop-down, will open a list. The classes at the top of the list apply to text. Scroll down past the text and image classes to the table class choices. This example uses the "Table with Header Shade & Borders" class.
I have added some data to the table. The next step is to add settings that will make the table accessible. Before these settings are added, a screen reader would read each cell from left to right and top to bottom. The third row would be read as "White blanco blanc bán gwyn" without any reference to which language each word belonged to.
| Color | Spanish | French | Irish | Welsh |
| Black | negro | noir | dubh | du |
| White | blanco | blanc | bán | gwyn |
| Red | rojo | rouge | ruadh | coch |
| Blue | azul | bleu | gorm | glas |
| Green | verde | vert | glas | gwyrdd |
| Yellow | amarillo | jaune | bui | melyn |
Accessible Tables
Each cell in the top row is a category for the words in that column. Sighted users can determine this relationship by scanning the table. To make this relationship clear to screen reader users, these cells need to become header cells with a scope of column.
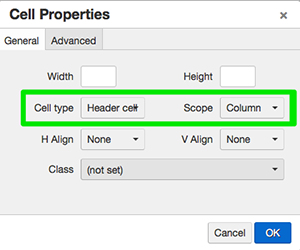 To do so, select each cell in the top row then go to the table tool. Click on Cell
> Cell properties. Once the Cell Properties window opens, choose the Cell Type: Header
Cell and Scope: Column. Click OK. The header cells in the top row now have a light
gray background and bold text.
To do so, select each cell in the top row then go to the table tool. Click on Cell
> Cell properties. Once the Cell Properties window opens, choose the Cell Type: Header
Cell and Scope: Column. Click OK. The header cells in the top row now have a light
gray background and bold text.
This styling depends on the settings in the Cell Properties window and on the class chosen in Table Properties. If you want the light gray background and bold text for header cells, choose a class that contains "Header Shade."
| Color | Spanish | French | Irish | Welsh |
|---|---|---|---|---|
| Black | negro | noir | dubh | du |
| White | blanco | blanc | bán | gwyn |
| Red | rojo | rouge | ruadh | coch |
| Blue | azul | bleu | gorm | glas |
| Green | verde | vert | glas | gwyrdd |
| Yellow | amarillo | jaune | bui | melyn |
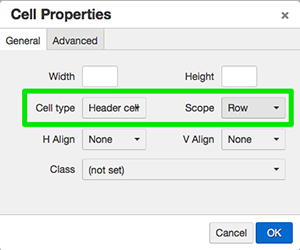 In the next step, select the cells containing Black, White, Red, Blue, Green and Yellow
text. Click on Cell > Cell properties. Once the Cell Properties window opens, choose
the Cell Type: Header Cell and Scope: Row. Click OK.
In the next step, select the cells containing Black, White, Red, Blue, Green and Yellow
text. Click on Cell > Cell properties. Once the Cell Properties window opens, choose
the Cell Type: Header Cell and Scope: Row. Click OK.
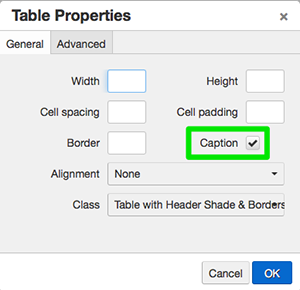 As a final step, add a table caption. Place your cursor anywhere inside the table.
Go to the table tool and select Table Properties. Check the Caption check box. An
area for the caption will open directly above the table. Add "Color Names in Multiple
Languages" and then click outside of the table. The table caption is now in place.
As a final step, add a table caption. Place your cursor anywhere inside the table.
Go to the table tool and select Table Properties. Check the Caption check box. An
area for the caption will open directly above the table. Add "Color Names in Multiple
Languages" and then click outside of the table. The table caption is now in place.
The table now has the accessibility settings of header cells, scope for columns, scope for rows and a table caption.
A screen reader would now read the third line as:
White, Spanish: blanco
White, French: blanc
White, Irish: bán
White, Welsh: gwyn
| Color | Spanish | French | Irish | Welsh |
|---|---|---|---|---|
| Black | negro | noir | dubh | du |
| White | blanco | blanc | bán | gwyn |
| Red | rojo | rouge | ruadh | coch |
| Blue | azul | bleu | gorm | glas |
| Green | verde | vert | glas | gwyrdd |
| Yellow | amarillo | jaune | bui | melyn |